When responding to incidents in the field, every second is valuable. But traditional incident reports often rely on lengthy and time-consuming descriptions that can be difficult to interpret. Why spend the effort on a potentially confusing written account when a simple diagram could do the trick?
Intersection Diagrams, a powerful new feature in the Incident Management module of CleverCAD, allows users to visually map out incidents with a familiar map interface, making it easier than ever to communicate what happened, where, and how.
The Challenge of Describing Incidents with Words Alone
Transit professionals know that describing an incident accurately can be harder than it sounds. Dispatchers and supervisors often find themselves writing out complex scenarios like:
“The bus was traveling eastbound on McLean Road when a truck ran a red light and struck the right side of the vehicle…”
While straightforward and factually accurate, this description leaves a lot to be desired, especially when shared across departments or used in legal documentation. If someone is unfamiliar with the area where the incident occurred, there can be a misinterpretation of precisely what happened.
What Are Intersection Diagrams?
Intersection Diagrams are a visual tool that lets users create a map-based representation of an incident. Using a drag-and-drop interface, supervisors and dispatchers can place vehicles, traffic signals, and annotations directly onto a digital map. The result is a clear, visual snapshot of the event that can be saved, printed, and shared as part of the incident report.
This feature is available on both desktop and mobile devices, including Android and iOS tablets, making it ideal for field supervisors who need to document incidents on the go.

Key Benefits of Using Intersection Diagrams
1. Clarity and Precision
Visuals eliminate ambiguity. Instead of relying on written descriptions, teams can see exactly how an incident unfolded—where vehicles were positioned, which direction they were traveling, and what obstacles were present.
2. Time Savings
Creating a diagram takes less time than writing a detailed narrative. It also reduces the need for follow-up questions or clarifications, streamlining communication across departments.
3. Improved Communication
Intersection Diagrams are included in incident reports and notifications, ensuring that everyone at your agency has a shared understanding of the event.
4. Field Accessibility
Supervisors can create diagrams directly from their tablets while on the scene. This real-time documentation enhances accuracy and streamlines the incident resolution process.
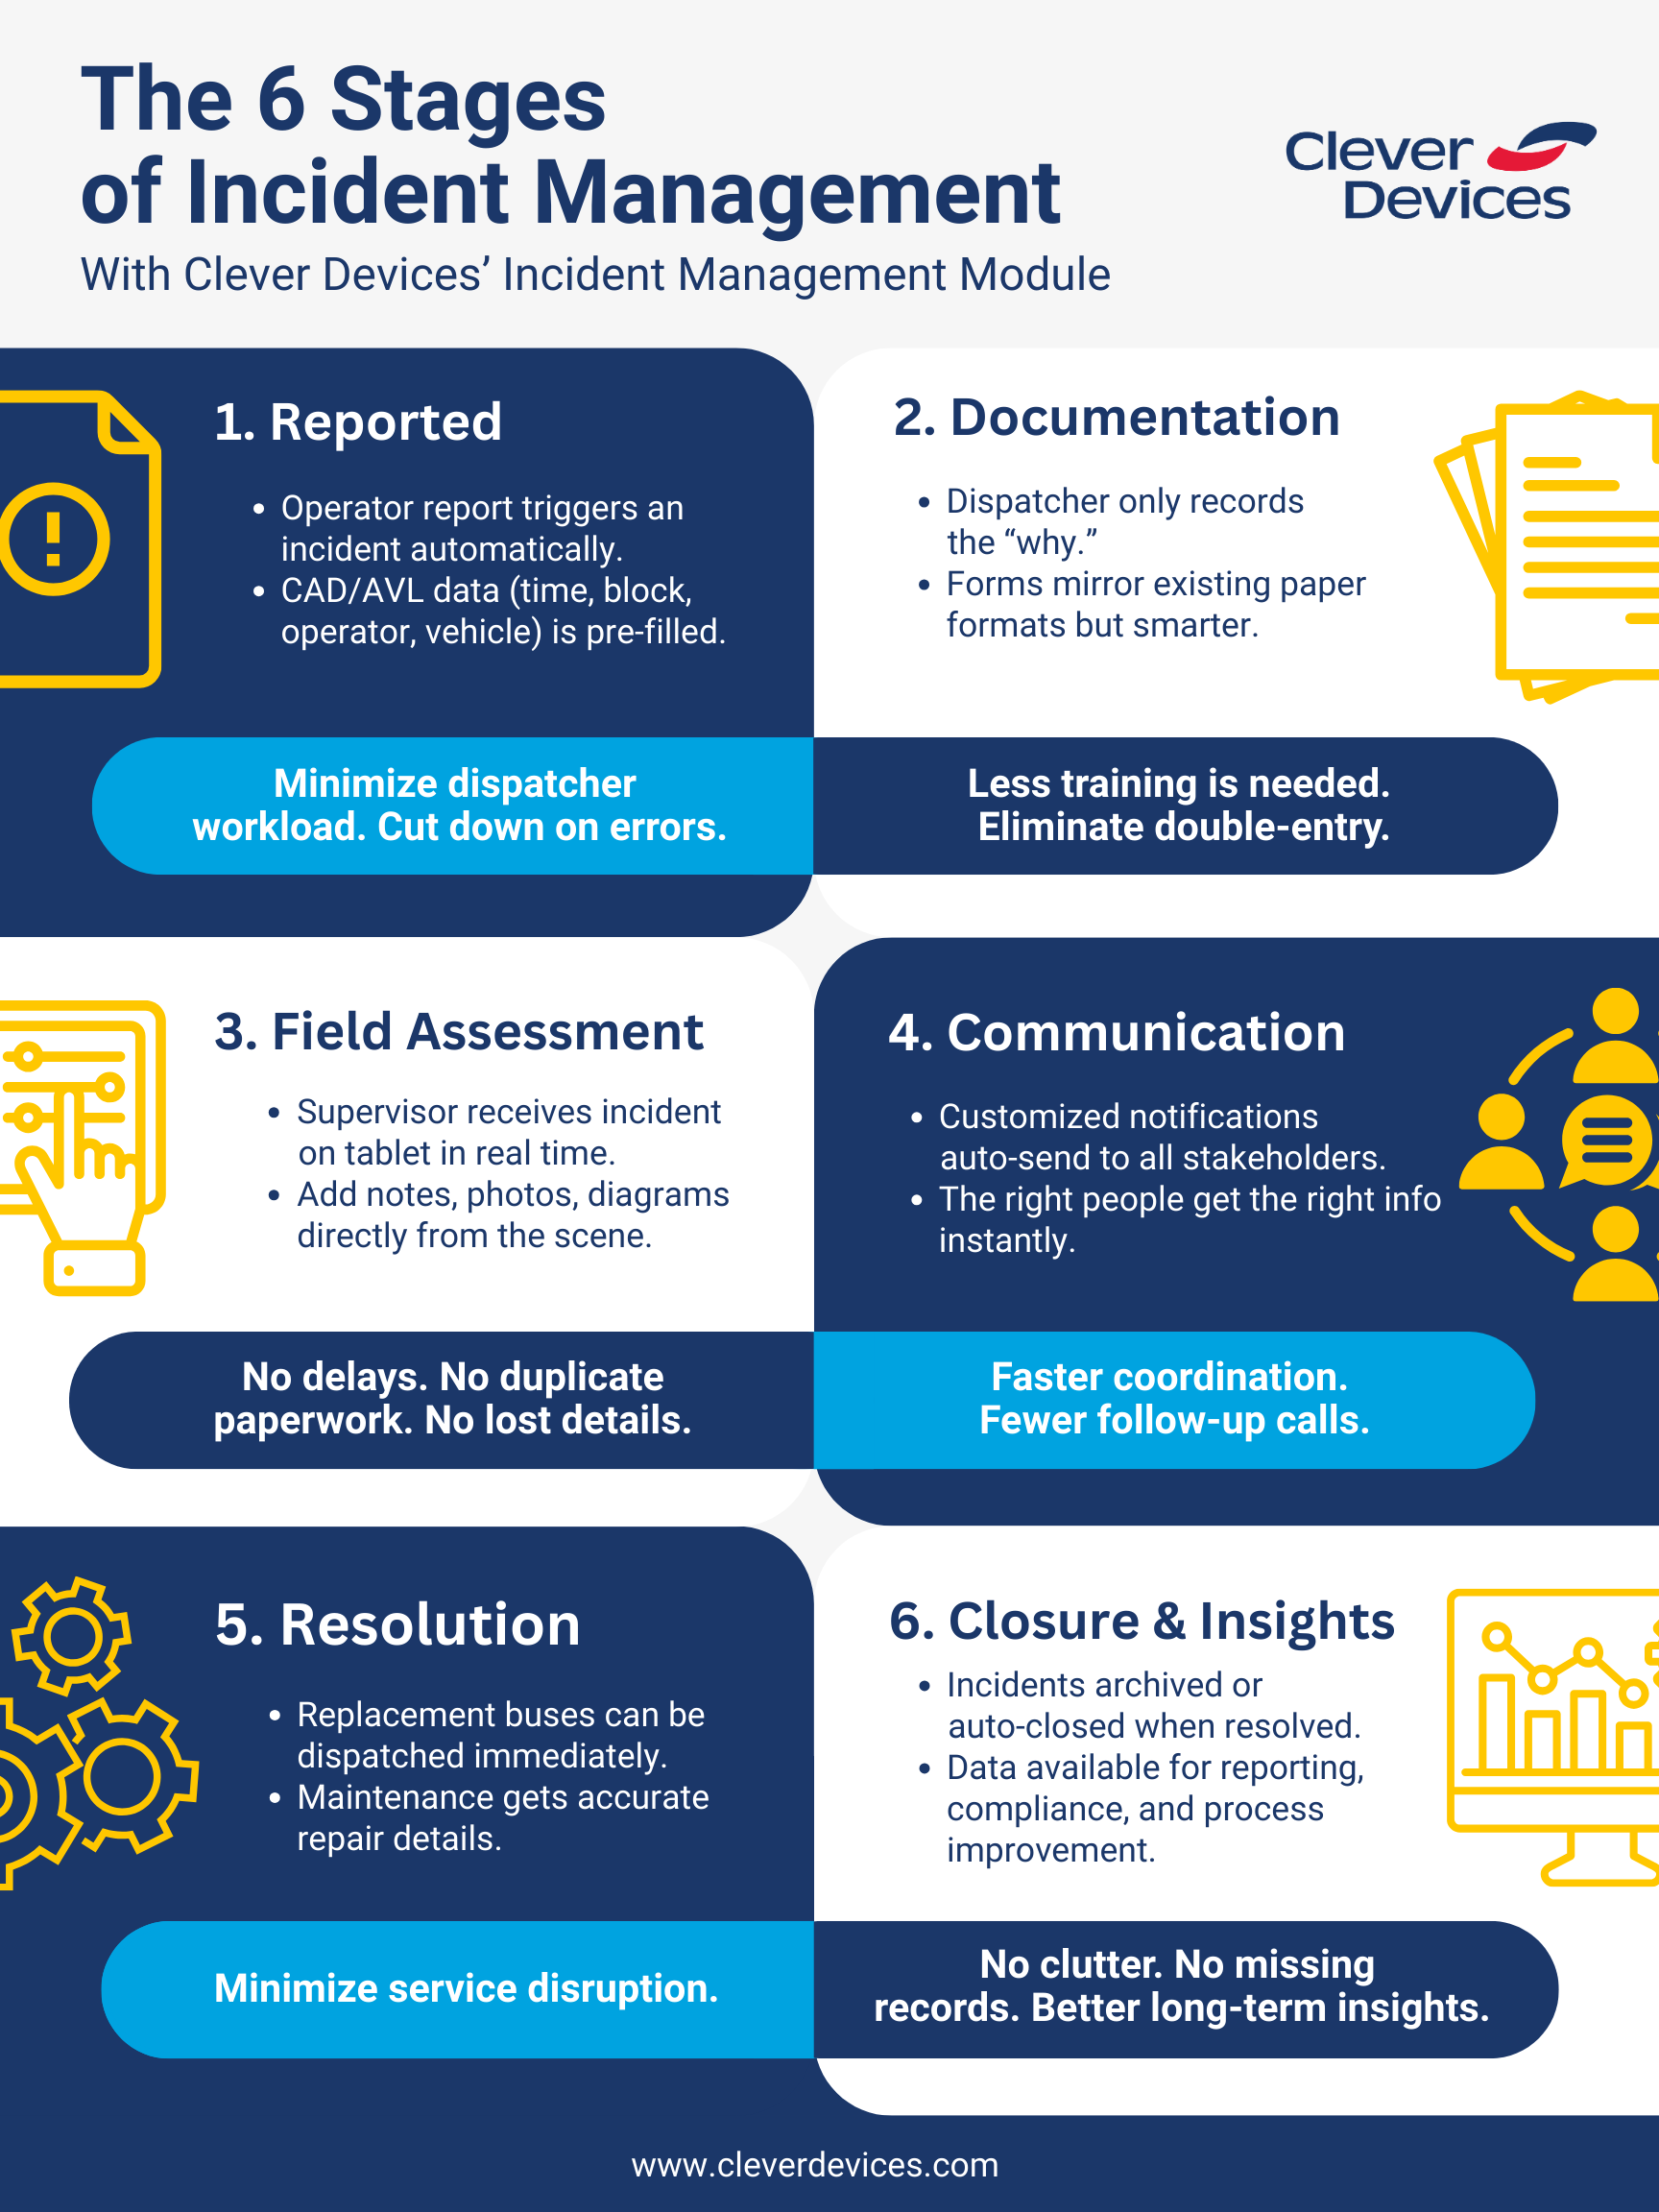
To explore all the ways Incident Management can streamline your incident reporting process, read our blog: The Pitfalls of Paper: Why Use Incident Management in CleverCAD.
Multi-Modal Applications: Beyond Roadways
One of the most exciting aspects of Intersection Diagrams is their flexibility. The tool features an intuitive map interface, enabling users to create diagrams for any location, not just traditional intersections.
- Rail Crossings: Document incidents involving trains, tracks, or crossing gates.
- Parking Lots: Capture vehicle damage, collisions, or customer complaints in non-road environments.
- Bus Terminals & Depots: Map out incidents in complex transit hubs with spatial accuracy.
- Pedestrian Zones or Transfer Points: Visualize events in areas with high foot traffic or multi-modal connections.
This makes Intersection Diagrams a valuable tool for agencies operating across multiple modes of transportation, including bus, rail, and paratransit.
Real-World Scenario: From Call to Diagram
Imagine a dispatcher receives a call from an operator reporting a collision. The dispatcher creates an incident in CleverCAD, and the system automatically fills in key details, such as block ID, operator name, and vehicle number.
A supervisor arrives on the scene with a tablet, opens the incident, and uses the Intersection Diagram tool to visually document the event. They place the bus and truck on the map, indicate the direction of travel, and add a note: “Truck ran red light, collided with right side of vehicle.”
The diagram is saved and attached to the incident report, providing a clear, visual record that can be used for follow-up, reporting, or legal documentation.

See Things Clearly with Incident Management
Intersection Diagrams are transforming how transit agencies document and respond to incidents. By replacing text-heavy reports with intuitive visuals, CleverCAD’s Incident Management module helps teams communicate more clearly, act more quickly, and operate more efficiently.
Discover additional insights and in-depth features of Incident Management by exploring the other articles in this series:
Looking for more details on CleverCAD? Download the eBook here.